Hack-A-Sat 2022: Power Level
Category: Signal Processing
Points: 104
Challenge
“What does the scouter say about their power level?”
Wait… you got angry and crushed your scouter. Go make a new one.Connect to the challenge on:
power_level.satellitesabove.me:5100
Observations
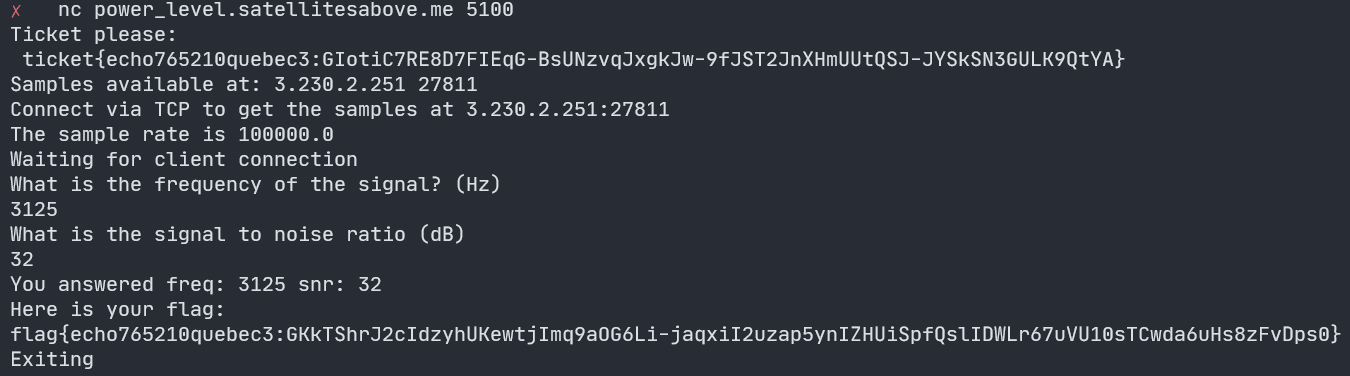
Connecting to the challenge server starts up a separate service that streams the data for a signal over TCP.
$ nc power_level.satellitesabove.me 5100
Samples available at: 3.230.2.251 18878
Connect via TCP to get the samples at 3.230.2.251:18878
The sample rate is 100000.0
Waiting for client connection
What is the frequency of the signal? (Hz)
We can record the signal to a file by connecting to it.
nc 3.230.2.251 18878 > power_level.dat
The server says that the sample rate is 100000 Hz and that it is providing us with 100000 samples. The size of the resulting file is 800000 bytes, which indicates that the data is stored as 8 bytes per sample.
The first prompt asks us to determine the frequency of the signal in hertz. This can be determined by importing the data into Matlab and using a periodogram.
Solution
First we import the recorded signal as an array of single-precision floats.
fid = fopen("powerlevel.dat", "r");
data = fread(fid, "single");

fs = 100e3;
n = 100e3;
fprintf("Sample Rate = %d (Hz)", fs);
fprintf("Sample Size = %d", n);
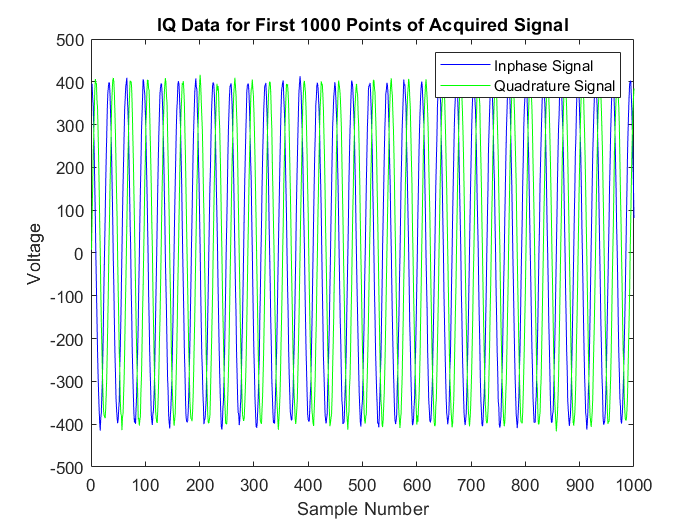
The signal is stored as interleaved I/Q data, so we must extract both parts into separate in-phase and quadrature arrays. We can then plot what the I/Q data looks like.
sig_I = data(1:2:end);
sig_Q = data(2:2:end);
IQ_data = sig_I + 1j * sig_Q;

figure(1);
plot(real(IQ_data(1:1000)), "b");
hold on;
plot(imag(IQ_data(1:1000)), "g");
legend("Inphase Signal", "Quadrature Signal");
title("IQ Data for First 1000 Points of Acquired Signal");
xlabel("Sample Number");
ylabel("Voltage");
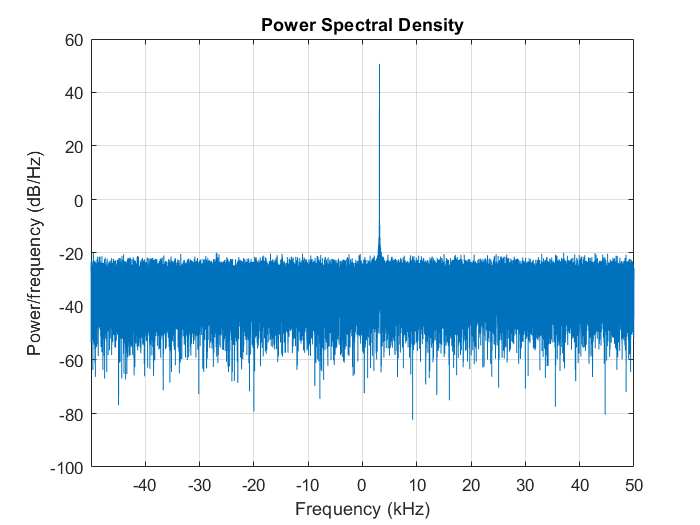
Now that we have the I/Q data, we can use a periodogram to determine the frequency of the signal.
% Create a periodogram spectrum with a Hamming window to visualize the max frequency
figure(2);
w = hamming(length(IQ_data));
periodogram(IQ_data, w, [], fs, "centered");
We can clearly see one frequency peaking at 3.125 kHz in the plot.
We can also just get the actual max frequency programmatically.
% Actually determine the max frequency using the periodogram
[pxx, F] = periodogram(IQ_data, w, [], fs, "power");
[pwrest, idx] = max(pxx);
fprintf("Frequency = %3.1f (Hz)\n", F(idx));
This will output “Frequency = 3125.0 (Hz)”, which is the first solution.
The challenge then asks us to determine the signal-to-noise ratio (SNR) of the sampled signal. We can easily do this in Matlab using the snr function with the real part of the complex I/Q vector.
SNR = snr(real(IQ_data), fs);
fprintf("SNR = %3.2f (dB)\n", SNR);
The reported SNR value is 32.11 dB, although the challenge will accept a range of values that are within a close enough margin of error.